Bee-level leakage
I don't know why but I've NEVER found puns funny, but I *did* however try again to experience the Art by naming my exploratory data analysis (EDA) (beeDA) (also I experimented with different...
…combinations of that (beeDA), like (BEEDA, beEDA, beeda), and comprehensively, none of them made it.
SO,
https://arxiv.org/pdf/2509.14061 did a work invovling BEE detection, I’ve stolen their figure 1:
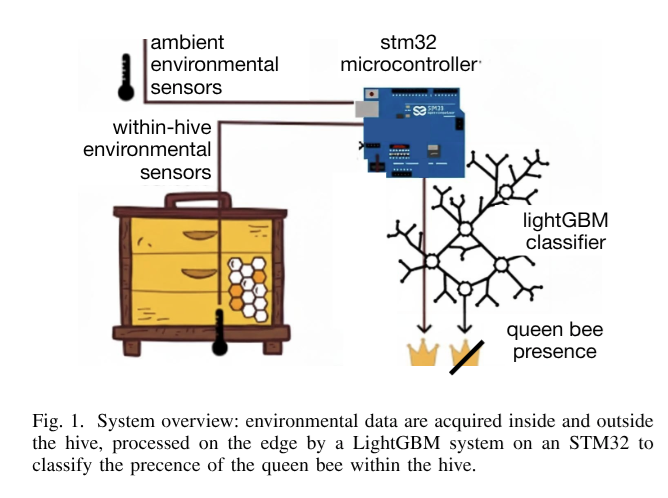
I think this is a cool idea, and reinforces my theory that all REALLY PRACTICAL COOL AI work is done with the old and wonky methods like gradient boosting as opposed to LLMS EVERYWHERE, especially since these people seem really into the idea of having their models run from within small energy efficient devices close-ish to the actual things they want to AI-upon (in British, “edge computing”, although this term will fall out of favor in the coming years).
BUT, their results are way too good to be true.
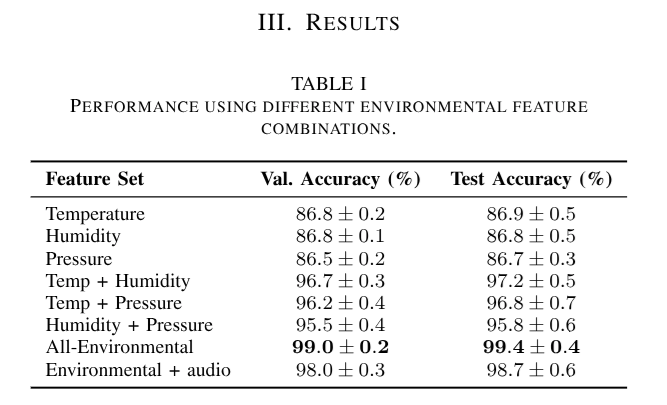
They themselves preempt the fact that these numbers aren’t really right —
“…the same hive may be represented in both the training and test sets, effectively simulating a scenario where the model benefits from a form of ’pre-training’ on that specific hive prior to deployment. While this setup is useful for proof-of-concept and in-hive applications, future work should focus on expanding the dataset to support generalization to unseen hives, which is essential for truly scalable and robust hive monitoring systems.”
Unfortunate.
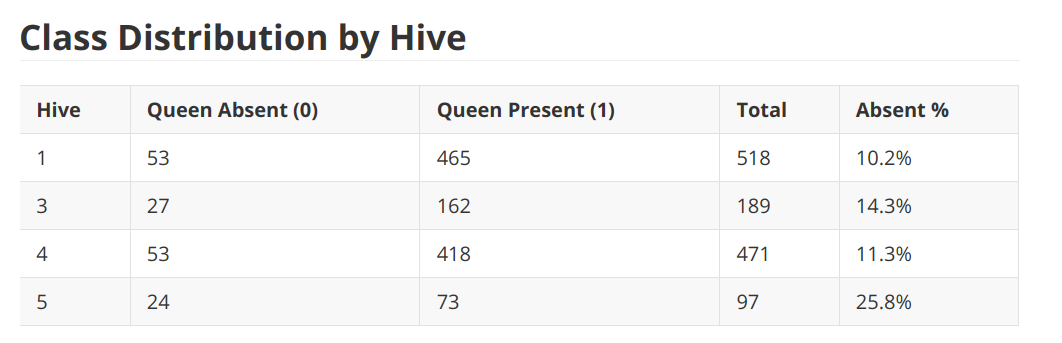
The dataset is public, and I wanted to try and see how well a classifier could do using more careful sample splitting:
Leave one group out (leave one hive out) ((LOHO)) cross validation: in machine learning, we want to learn how well our models of the world can be used to predict unseen cases. For queen presence in hives, we might care about how the model does in a hive in an entirely different country, maybe during the rain or in a high humidity time? (Don’t know much about bees personally but they seem neat, last week I tried to pet a maybe bumblebee because I read they were friendly but a friend of mine* prevented me from doing so)
…so maybe the original authors models did really well at using hive 1’s data to describe and predict hive 1’s behavior, and hive 2’s to predict hive 2’s, but this might have resulted in a model that’ll start failing when hive 24601 in a completely different environment’s employers start asking for a good predictor of queen presence
SO, we try making this problem more difficult for the AI to see if we can get models that are good at predicting out of hive behavior: train on every hive but one, then PREDICT on that last hive, and report how well we “generalize across hives”.
- Note that this leaves questions of how well we generalize to other things completely on the table. Is there a rainy hive we could test on?
Also, TEMPORAL predictions:
- This is a bit tricker. BUT, the data, which is public, looks like this:
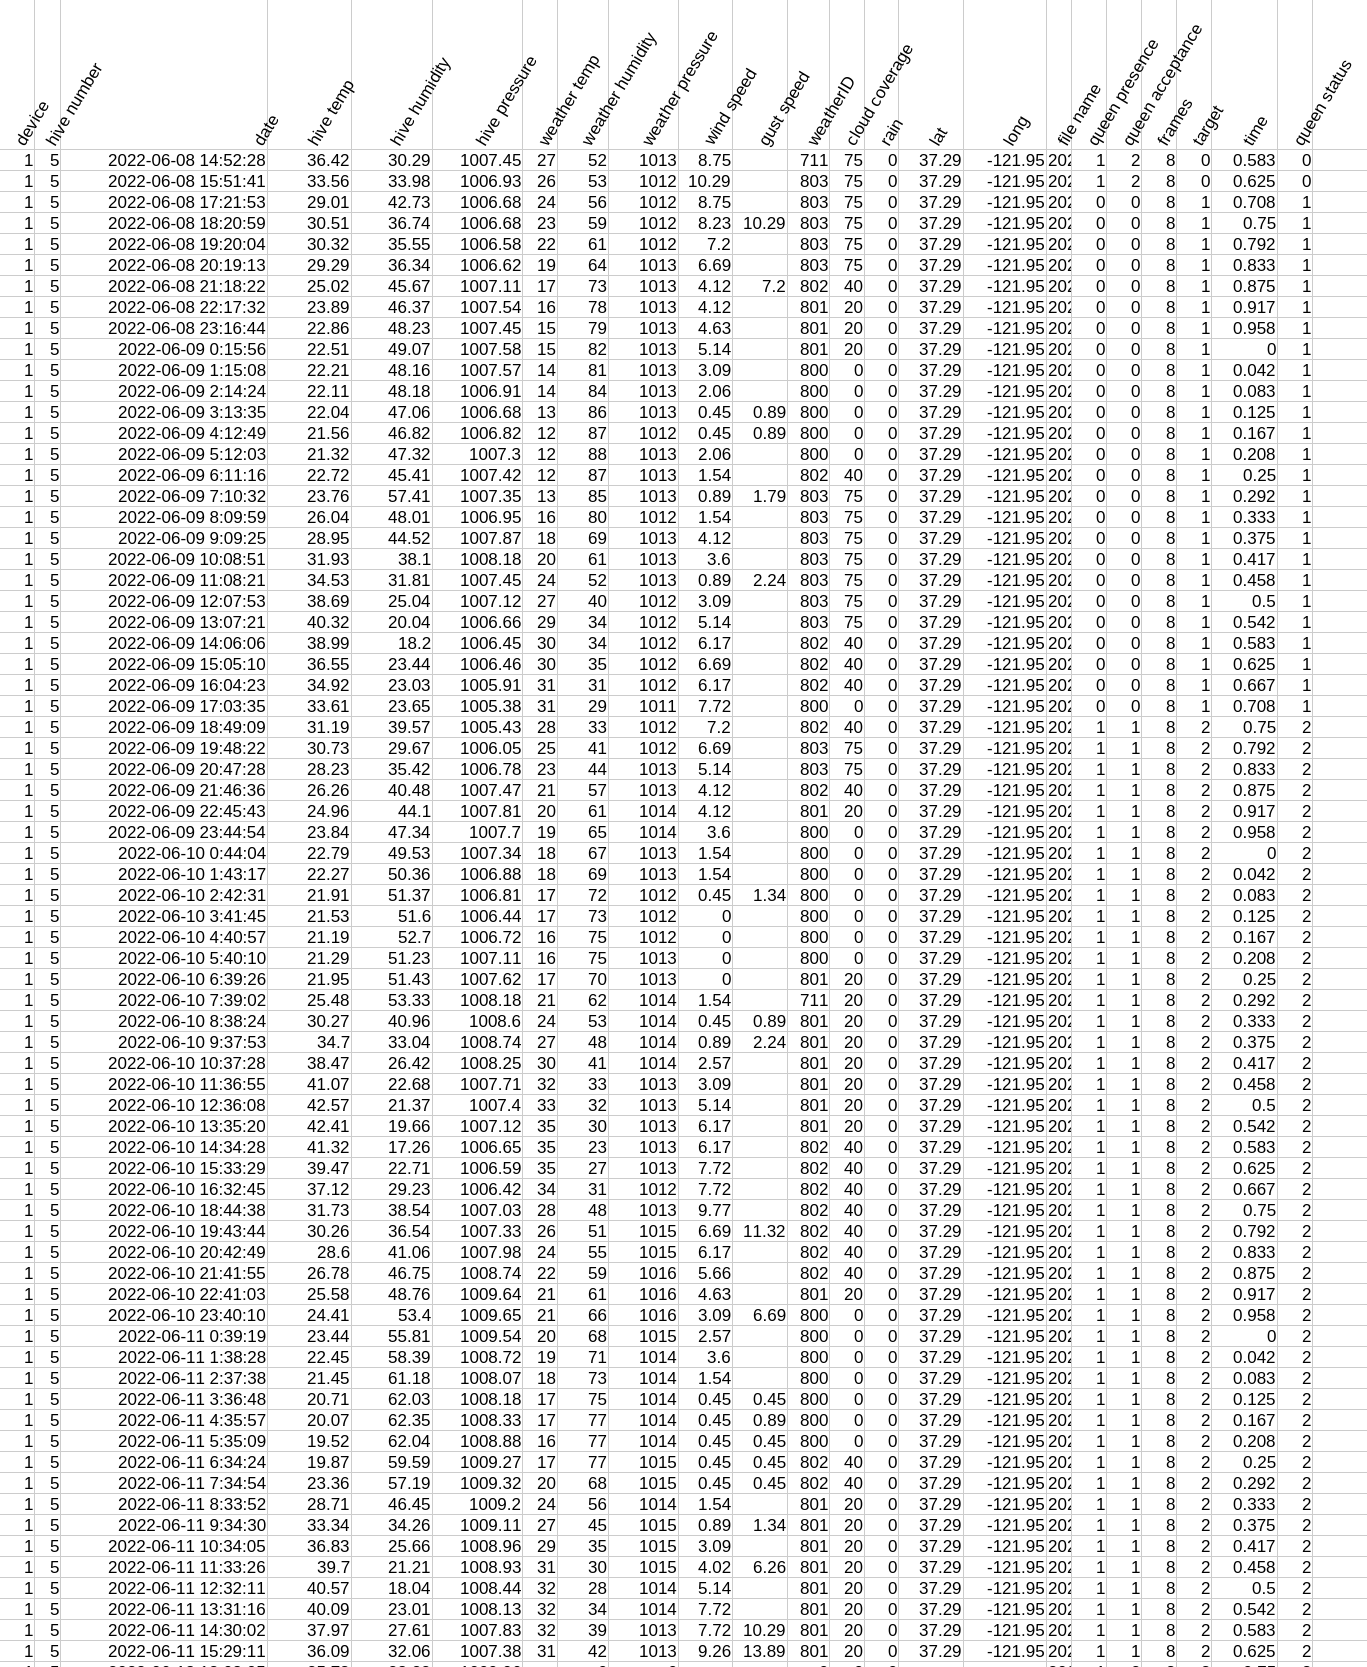
Which if you squint at really hard, you might notice that the patterns of queen visiting (“queen presence”) each hive are like HERE, HERE, HERE, HERE, HERE, HERE, HERE, HERE, HERE, HERE, HERE, HERE, HERE, HERE, HERE, GONE, GONE, GONE, GONE, GONE, GONE, GONE, GONE, GONE, GONE, GONE, GONE, GONE, GONE, GONE, GONE, GONE, GONE, GONE, GONE, HERE, HERE, HERE, HERE, HERE, HERE, HERE, ….
i.e. there’s chunking. One of the assumptions that these models sometimes make is “i.i.d.”, in that the data is identical and independently distributed. There’s vicious stats behind this, but one quick check is: is there some correlation** between one visit and the next? Here, yes.
So, we do temporal chunking. We use a bunch of time to fit the model’s parameters, then we ignore a chunk of time after, then we evaluate on later times. We repeat this a whole bunch WITHIN the training hives, making a sort of two-layer cross validation.
- Why two-layer cross validation? Well not only do we have to fit the model’s parameters (like the linear regressions slope and intercept), some models have *hyper*parameters, which can include things like how many “leafs” to include in some tree algorithms, etc. We want to optimize the hyperparameters, finding the best performing setting for our models on the inner loops, THEN take that best performing one and evaluate how well it does on the other HIVE (the outer loop).
Dangerously vibecoded source at the bottom***
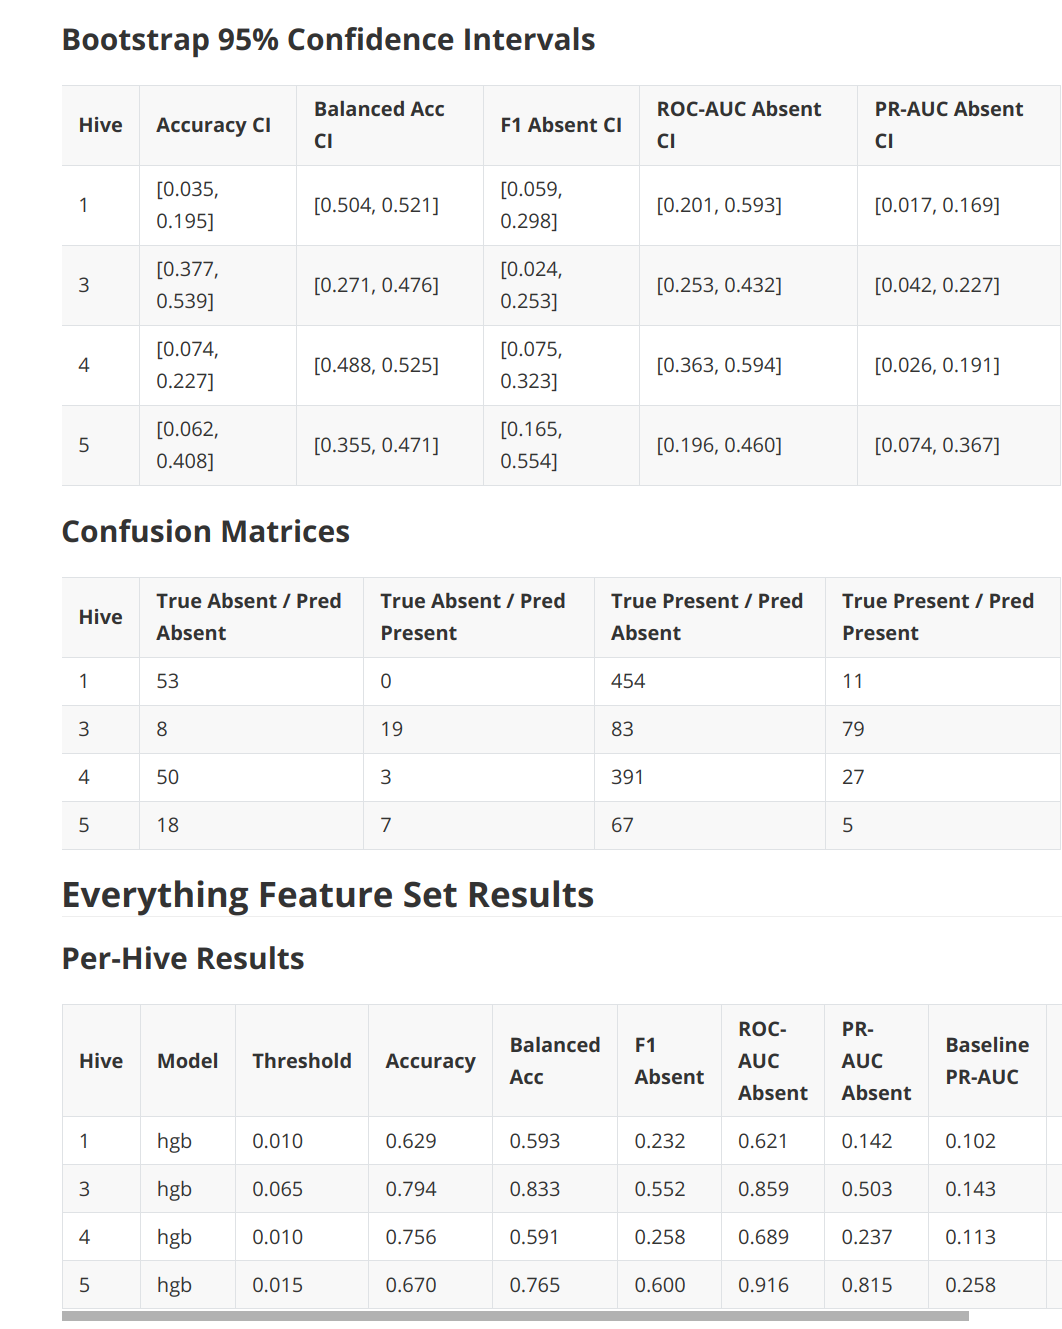
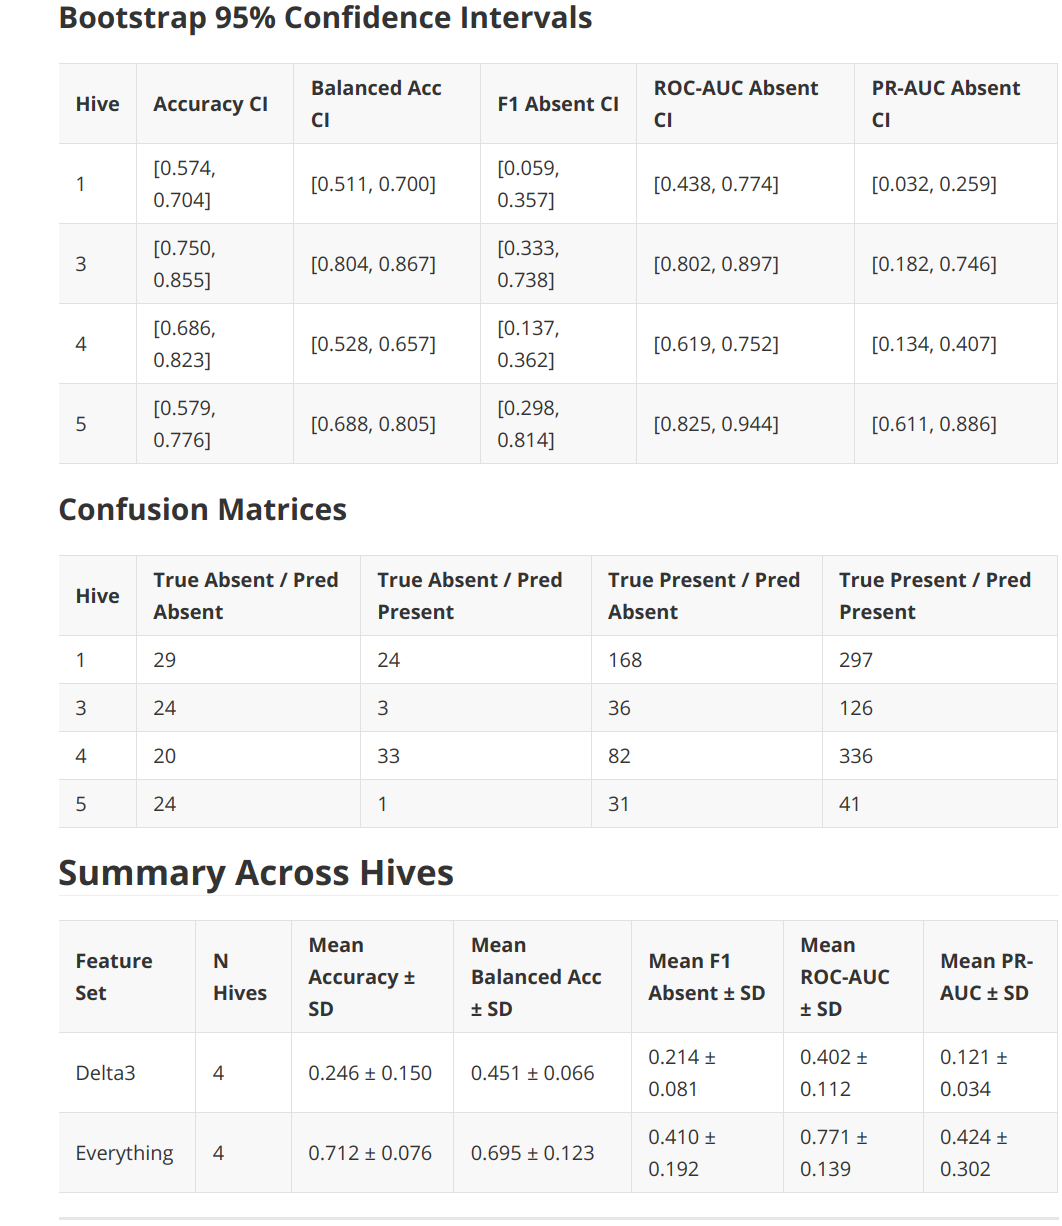
Anyways, here are the results:
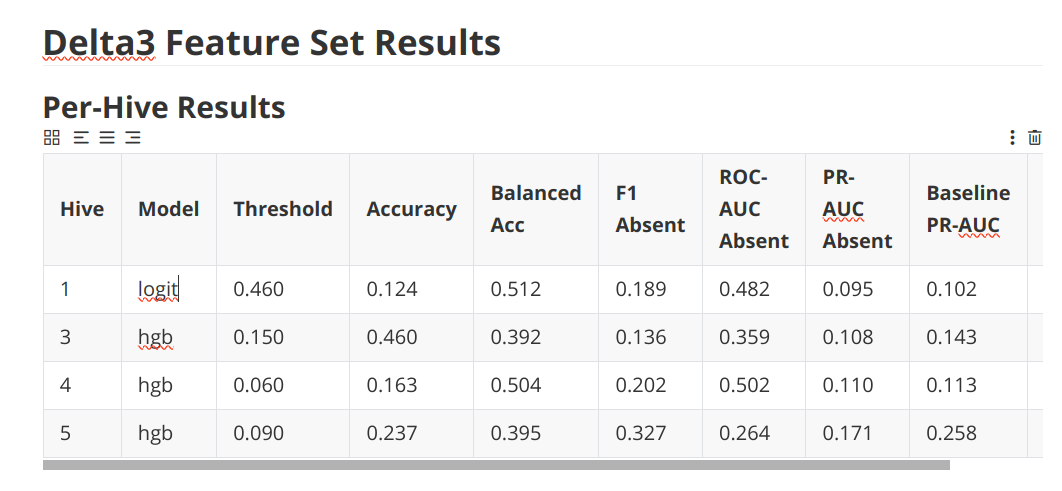
Welcome back! Your eyes glazed over those tables. Hm.
WHATEVER. Basically was a quick dump of a quick test of a published paper.
And I wanted to check the original author’s three features vs using everything but sound, which is Delta3 vs Everything features.
AND, the results are that we don’t get anywhere near 99% accuracy in any case.
*A friend of mine, yes
**stats trap: things can be completely not correlated yet be dependent! a parabola’s line of best fit would be flat, but I could totally model one missing point in a parabola given the rest, I’m pretty clever. Being able to model stuff is the key: does there exist information that we could possibly use.
***